Introduction #
As I mentioned in my earlier post about my Personal Best chat bot, speedrunning is a niche rich with stats. For most speedrunners, their LiveSplit file tells a highly objective and interesting story of their journey from their first runs, through to their latest personal best. LiveSplit is the gold standard when it comes to timing software with comprehensive customisation features and an intuitive layout familiar to Speedrunners and spectators alike. Under the hood, there is a wealth of data stored ranging from excruciating detail about each split (distinctly timed section of a speedrun) to high-level aggregate data such as the total number of attempts.
When speedrunners share their latest achievement (i.e. PB or even a world record), this is usually in the form of a video recording of their run and often supplemented by a Discord/X post with their splits.
After getting used to this meta, I started to wonder if there was a better way to tell the story of the runner’s overall journey in a simple overview, giving audiences a broader understanding of the scale of the achievement and progression. This is when I first got the idea for SplitDash, a thumbnail generator which would take the runner’s Livesplit file as input, and convert it into a visual and engaging dashboard to showcase the progression and top-level stats of a run that onlookers are always interested in.
Dash #
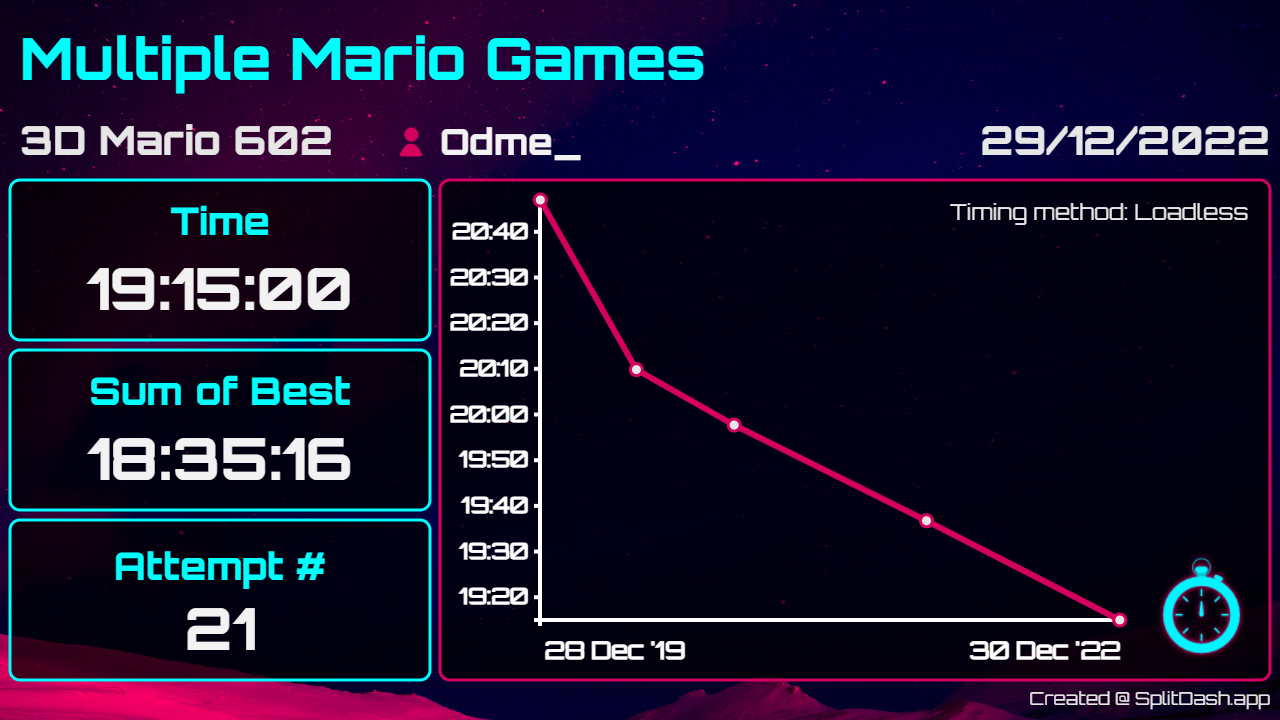
I coined this overview a ‘dash’, and decided it would include:
- Game Name
- Category
- Username
- Date
- Personal Best Time
- Sum of Best
- Number of Attempts
- Timing Method
- Time-series Chart of Past Run Times
It sounds like a lot when listed out in this way, but using this prioritised list of stats and metadata provided a great balance for providing answers to all of the main questions spectators would have about a run. In contrast to the snip of the runner’s splits, a dash is presented in a landscape view, optimised for the common social media image sizes (e.g. YouTube thumbnail, X post).
While a small percentage of speedrunners are dedicated content creators, the majority of runners are not creating specialised thumbnails or content posts to celebrate their personal bests - so SplitDash provides an alternative to this with a stylish and easy-to-create thumbnail for their video (which would otherwise be left as the random frame auto-selected by YouTube).
Example Dash
Design, Content & Layout #
The design of each dash is created in an elaborate D3.js layout. The content of the dash is dynamically generated from the initial LiveSplit file upload and can then be further edited in real time using edit mode.
A key design choice I made is that the dash is rendered as an SVG in the browser window and is only converted to a PNG at the time of download. This enabled the fields to be highly responsive right up until the download button is pressed, giving everything a highly dynamic feel, while also looking exactly as it would appear in the static PNG file which would appear in your downloads.
The layout also uses a set of thresholds to determine which granularity of times to display, ensuring that the axes show a sensible range and the overall times hide/show decimals and hours if needed.
Split-specific options are also editable to ensure the runner can show the narrative that they desire i.e. timing method, show PBs only or all finished runs.
If the category or game names overflow, a warning shows advising the user to shorten it, the font sizes were selected so that they comfortably fit the layout so resizing dynamically is not provided to mitigate the possibility of the design becoming unbalanced.
Fonts were an interesting challenge as while you can easily display them in most browsers by referencing correctly, to include the necessary fonts in the downloaded versions the binary versions need to be provided as the source in @font-face, otherwise they will look fine in the browser, but download with default fonts applied. This bug only became apparent when testing on other machines, as I already had all the fonts downloaded on my local development machine meaning that the issue was hidden, even when testing in the production app on my local development machine.
Tech stack #
- Django Server
- React Frontend
- SASS Styling
- Deployed on GCP Cloud Run
- Docker
Limitations #
The primary limitation of this app is the difficulty of creating new dash designs. Naturally, with something that is designed for sharing on social media, customisation is desirable. Due to the way dashes work in their current state, there is not currently a way to create a custom template. It is certainly possible, as an editor could be created to enable the moving around of the boxes, switching out background images/colour schemes. This would be quite a significant update and is not something I plan to implement at present, however, I do plan to open-source the existing code once I have an opportunity to document it. For the future of SplitDash, I think I would prefer to convert it into more of a local tool, as I do not think there is much of a need to have the dashes themselves as easily shareable.
Conclusion #
While SplitDash is not currently in active development, it was an immense learning experience for me and is a very special project for me in the context of my developer journey. It is a truly end-to-end experience completely developed solo, and while it isn’t perfect, I am extremely proud of how closely it met my original vision of the app.